If you are looking to buy or sell a house in Fort Thomas, KY, what are the real estate trends looking like? In our first installment of a market update video, we take a look at the Fort Thomas real estate market and how it impacts you.

VIDEO TRANSCRIPT:
Hey everyone, this is Eric Sztanyo from Keller Williams Realty and TeamSztanyo.com where we are helping you build a bridge to your future real estate dreams.
In this video, our first attempt at this, I wanted to do a market update. We’ll be looking at the real estate trends for different neighborhoods across Northern Kentucky and Cincinnati, and I’m starting with Fort Thomas, KY. Why? Because, I live in Fort Thomas, KY.
My wife and I have lived in Fort Thomas, KY for 7 years now, and we love it! Fort Thomas is amazing! If you are looking at moving to Fort Thomas, I highly recommend it. It’s an amazing community. For those of you who live in Fort Thomas and are looking to sell, you know this to be true. Our oldest son is at Moyer Elementary. We have 4 kids, and it’s an incredible community if you are wanting to raise a family. I highly recommend it.
We’ll do another video where we talk about all the amenities and how great Fort Thomas real estate is.
In this video, I want to get into some of the recent market dynamics that have happened. We’re going to get into a two year period of Fort Thomas real estate market trends, so you can get a feel of if this is a good time for selling your house in Fort Thomas. Or, if you are buying and looking to move into Fort Thomas, what might you be looking at. So, let’s dive in and look at the numbers.
Fort Thomas Real Estate Market Update
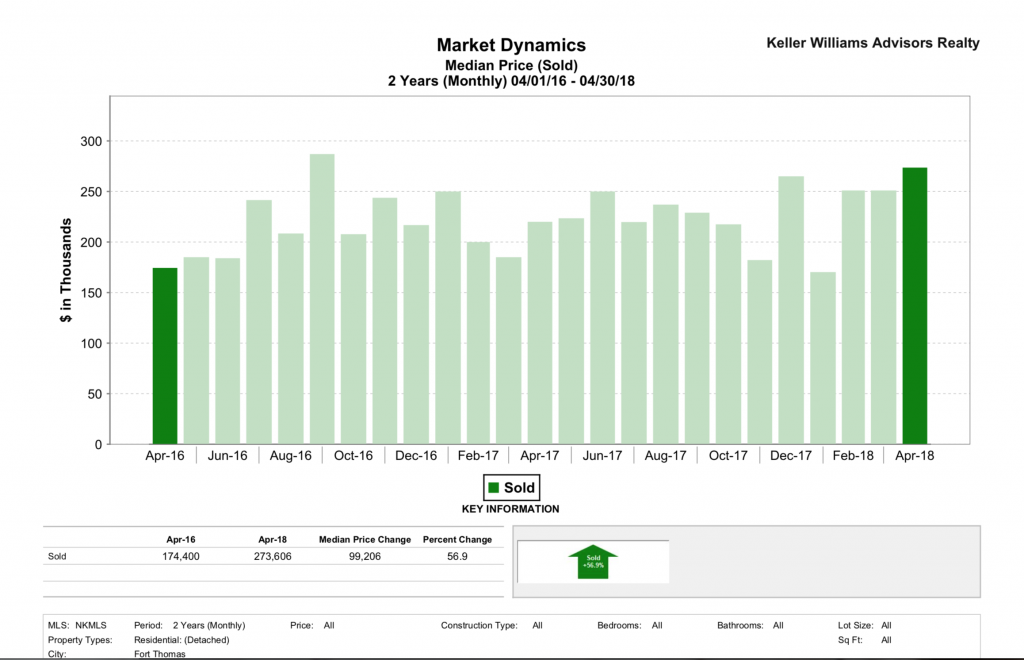
Ok, so what we are looking at here is a time range from April of 2016 through April of 2018 – two years of monthly reports. We’re looking at different market dynamics in Fort Thomas, KY, and I wanted to start with the median price of houses sold.
What we see is going back to April of 2016, the median price was $174,000, and here in April of 2018, the median price was $273,000, almost $274k – a difference of nearly $100,000 in median price change. So, this is a HUGE difference in change. There is a 57% increase in terms of the numbers of thousands of dollars in the median sale price sold. So, this is good news if you are a seller.
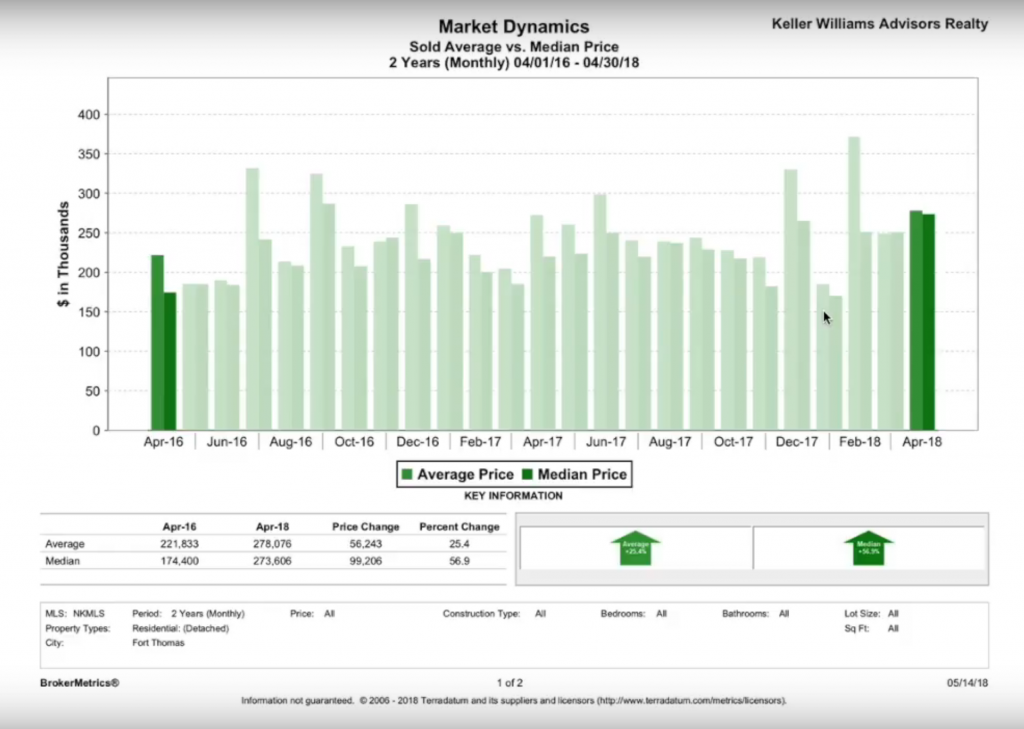
The second report has still those median numbers, but it also compares the average sale price in Fort Thomas. So, this is maybe a little bit more realistic view of what the market has done over the past 2 years. What you see here in the average numbers is that back in April of 2016, we were at $222,000 for an average sale price. Here in April of 2018, we are at $278,000.
This is still a large increase. What you are seeing over the past two years is an increase of 25% in average sale price in Fort Thomas, KY, which equals a little over 12% appreciate per year. The market has risen and fallen in different seasons of the year. The highest average was actually in February 2018.
Let’s go onto the next report and try to figure out how to interpret this data, so we’re not just looking at charts.
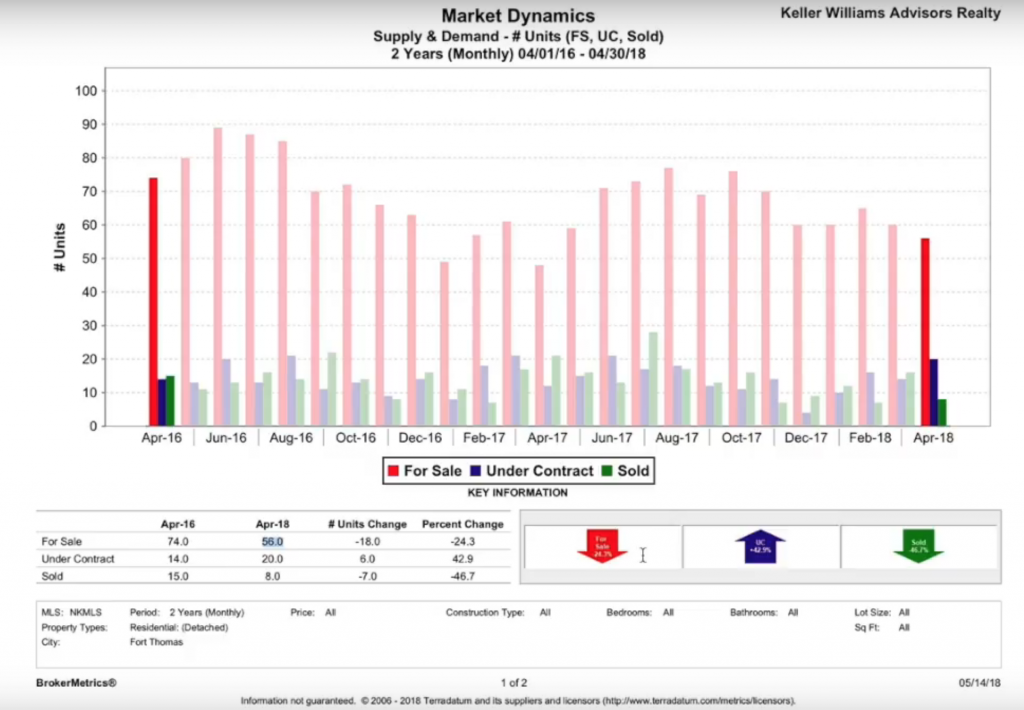
This report is the supply and demand of detached residential units in Fort Thomas, and what you see is that the inventory has gone down. In April of 2016, there were 74 units for sale and in April 2018, there were 56 units. The amount of inventory has gone down 24%.
The average price has gone up 25% and the average amount of inventory has gone down 24%. So, if you are a seller, this is great news for you because it is a seller’s market. The prices are higher than they have been and the inventory is lower. That’s great news for you.
If you are a buyer, it’s certainly more challenging of a market for you. It doesn’t mean that you can’t get into Fort Thomas, but it does mean that it is more of a seller’s market. You need to be able to move quickly and make sure you have all your ducks in a row if you are wanting to buy a house in Fort Thomas. You can go look at this video we created that has 8 tips for buyers in a seller’s market.
One last report that shows some of the same information, but a bit of a different take on it. This report shows the months of supply of inventory. The supply of inventory means if you take a look at the average days on market and the amount of homes that are out there, how many months will it take to sell all of the homes on the market.
Back in April of 2016, the monthly supply was 4.1. Here in 2018, you are at 1.7. So, it says a bit of the same information which is that the housing inventory is down from 2 years ago. The percent change is down about 60%.
Typically, you will see more inventory come on the market in May, but you also see more buyer activity in May in June. Inventory tends to get higher in the spring and lower in the winter months. In December of 2017, there was a big spike in inventory, but it has gone back down in the past few months as buyers are buying homes.
So, that’s a look at the data and market trends for real estate in Fort Thomas, KY. What you’ll see if you are looking across different NKY markets or Cincinnati, there are similar trends, but every market is going to be a little different.
That was a quick look at some of the data and trends for Fort Thomas real estate. To boil it all down, it’s a seller’s market. If you have been thinking about selling your house in Fort Thomas. Maybe you want to upgrade or you are relocating to another area, now is a good time to be selling your house. The inventory is low. The average sale price is higher, and you will probably get a good price on your house if you list it in the near future.
If you are looking to buy a house in Fort Thomas, it’s good to know that it is a seller’s market right now. It doesn’t mean that you can’t buy a house. Obviously, homes are being bought in Fort Thomas, KY, but the current market is more difficult. So, if you want to buy, be ready.
If you need help buying or selling your house in Fort Thomas, KY, give us a call or fill out the form below.
If you want a 100% Free Home Value Report for your Fort Thomas, KY house, go here.
Contact Us | Let’s Talk About Your Real Estate Goals
Whether you’re buying, selling, or just exploring your options, we’re here to guide you.